It has been a blast!
Back in 2013, Qlik launched something called The Qlik Luminary Program with 10 "Charter" members drawn from some of their larger customers.
At the time, to be honest, I didn't really pay a lot of attention to it. I didn't know any of the charter members, and I didn't really know what the program was for, or even how to get involved with it. I was also pretty busy with other stuff! As well as spending my days pretty much working all the time with QlikView, and leading a team of QlikView developers, I had just published the QlikView for Developers Cookbook that June and was working on QlikView Server and Publisher.
What I didn't know was that Qlik were planning to anoint a set of people from their ecosystem to be Qlik Luminaries, and had polled their own people for candidates. It came as a pleasant surprise to me when I heard from Miguel Angel Baeyens de Arce, then an Enterprise Architect at Qlik, that he had nominated me and that I had made the grade!
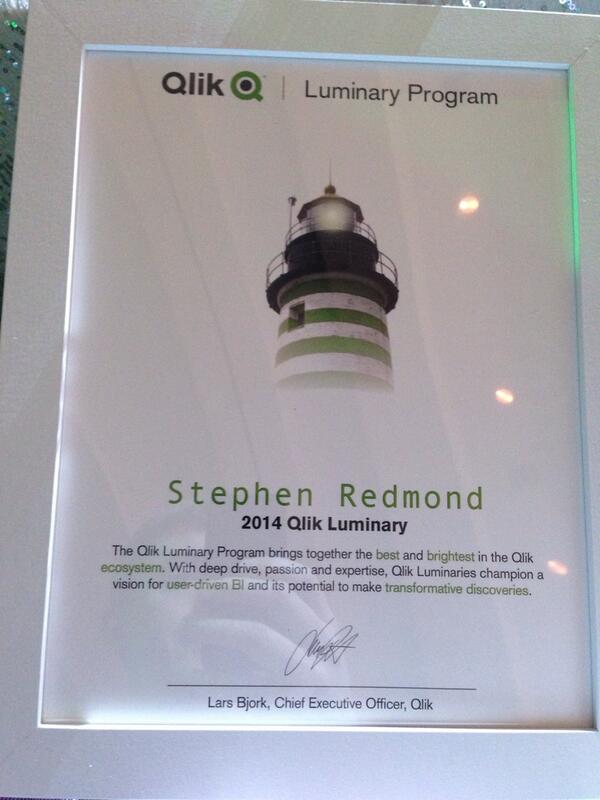 |
| First Luminary certificates signed by former Qlik CEO Lars Bjork |
At Qonnections 2014 the new class of Luminaries were well feted. It was great to make a lot of new friends there, especially Torben Seebach, with whom I pounded the Orlando sidewalks at ungodly hours before the sun came up to make it too hot to run. It was a great week.
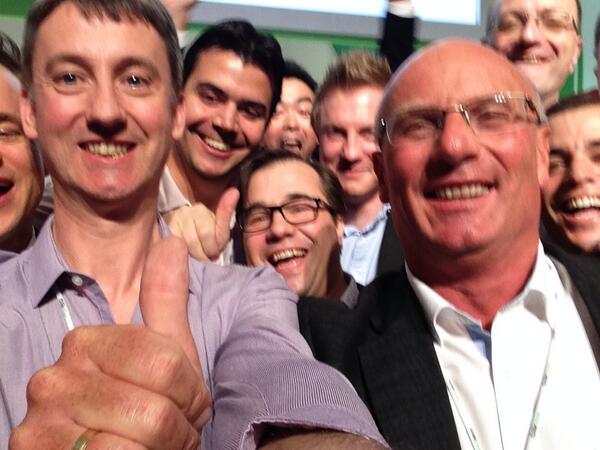 |
| Luminary Selfie 2014 |
We had an equally good time later that year when attending the Qlik Sense launch in Barcelona - where our Luminary status so overawed Brian Booden that he decided to spill his drink on me!
That was sadly the last big Qlik event that I got to attend for a while. Not long after publishing Mastering QlikView, I moved to work for Deutsche Bank - one of Qlik's large customers. It is fair to say that I had some good supporters within Qlik because, despite a drop off in social media activity and blogging, I managed to do enough to maintain my Luminary status through my period there.
My next job move moved my back to the Partner ecosystem, joining one of Qlik's biggest global partners, Accenture. I was luckily able to get back to Qonnections in 2018, and it was great to meet all my Luminary friends again.
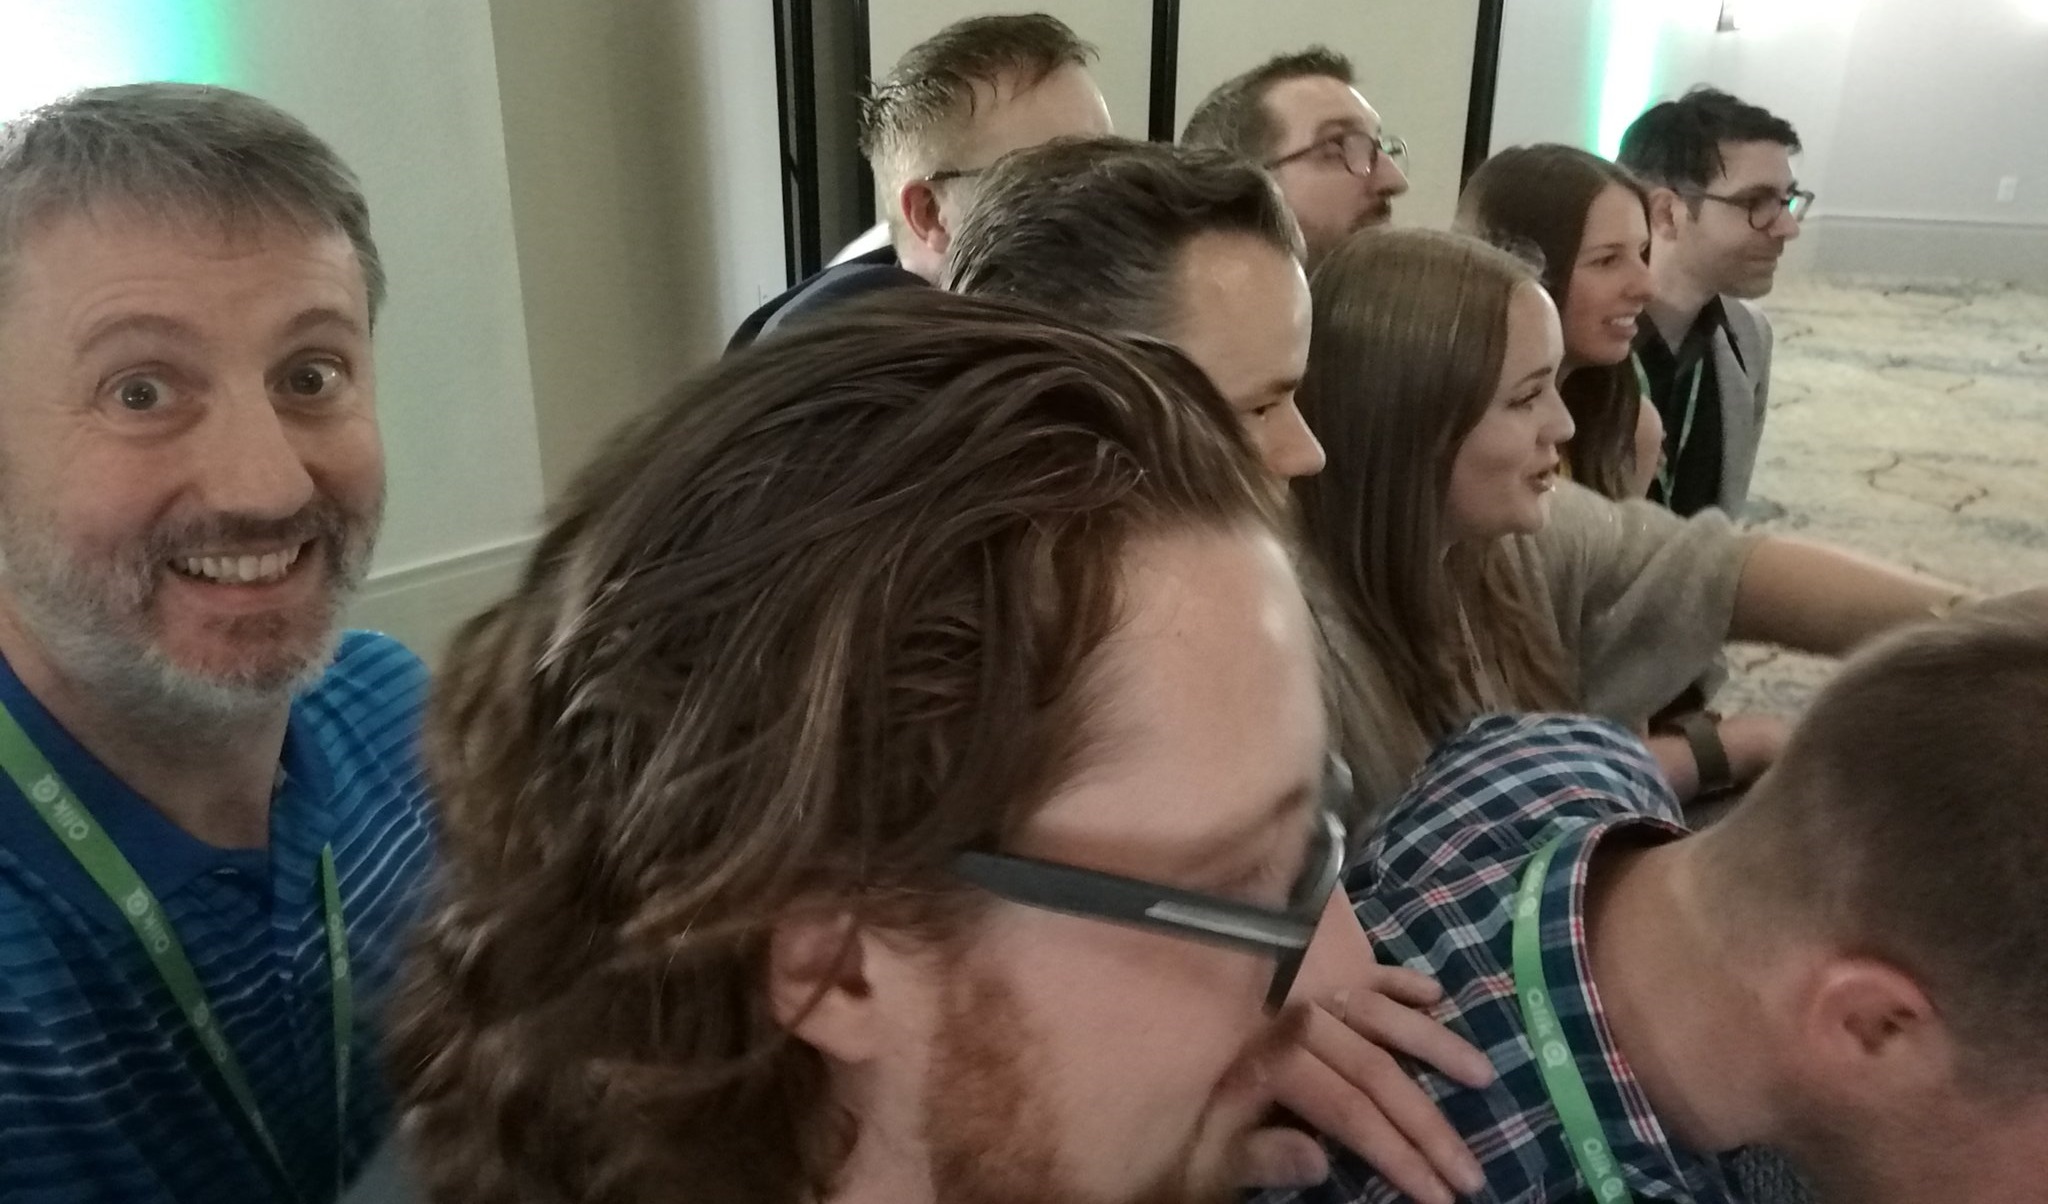 |
| Luminary Selfie 2018 |
A big highlight of that year was the couple of days in Lund at the Luminary meetup at Qlik's original headquarters.
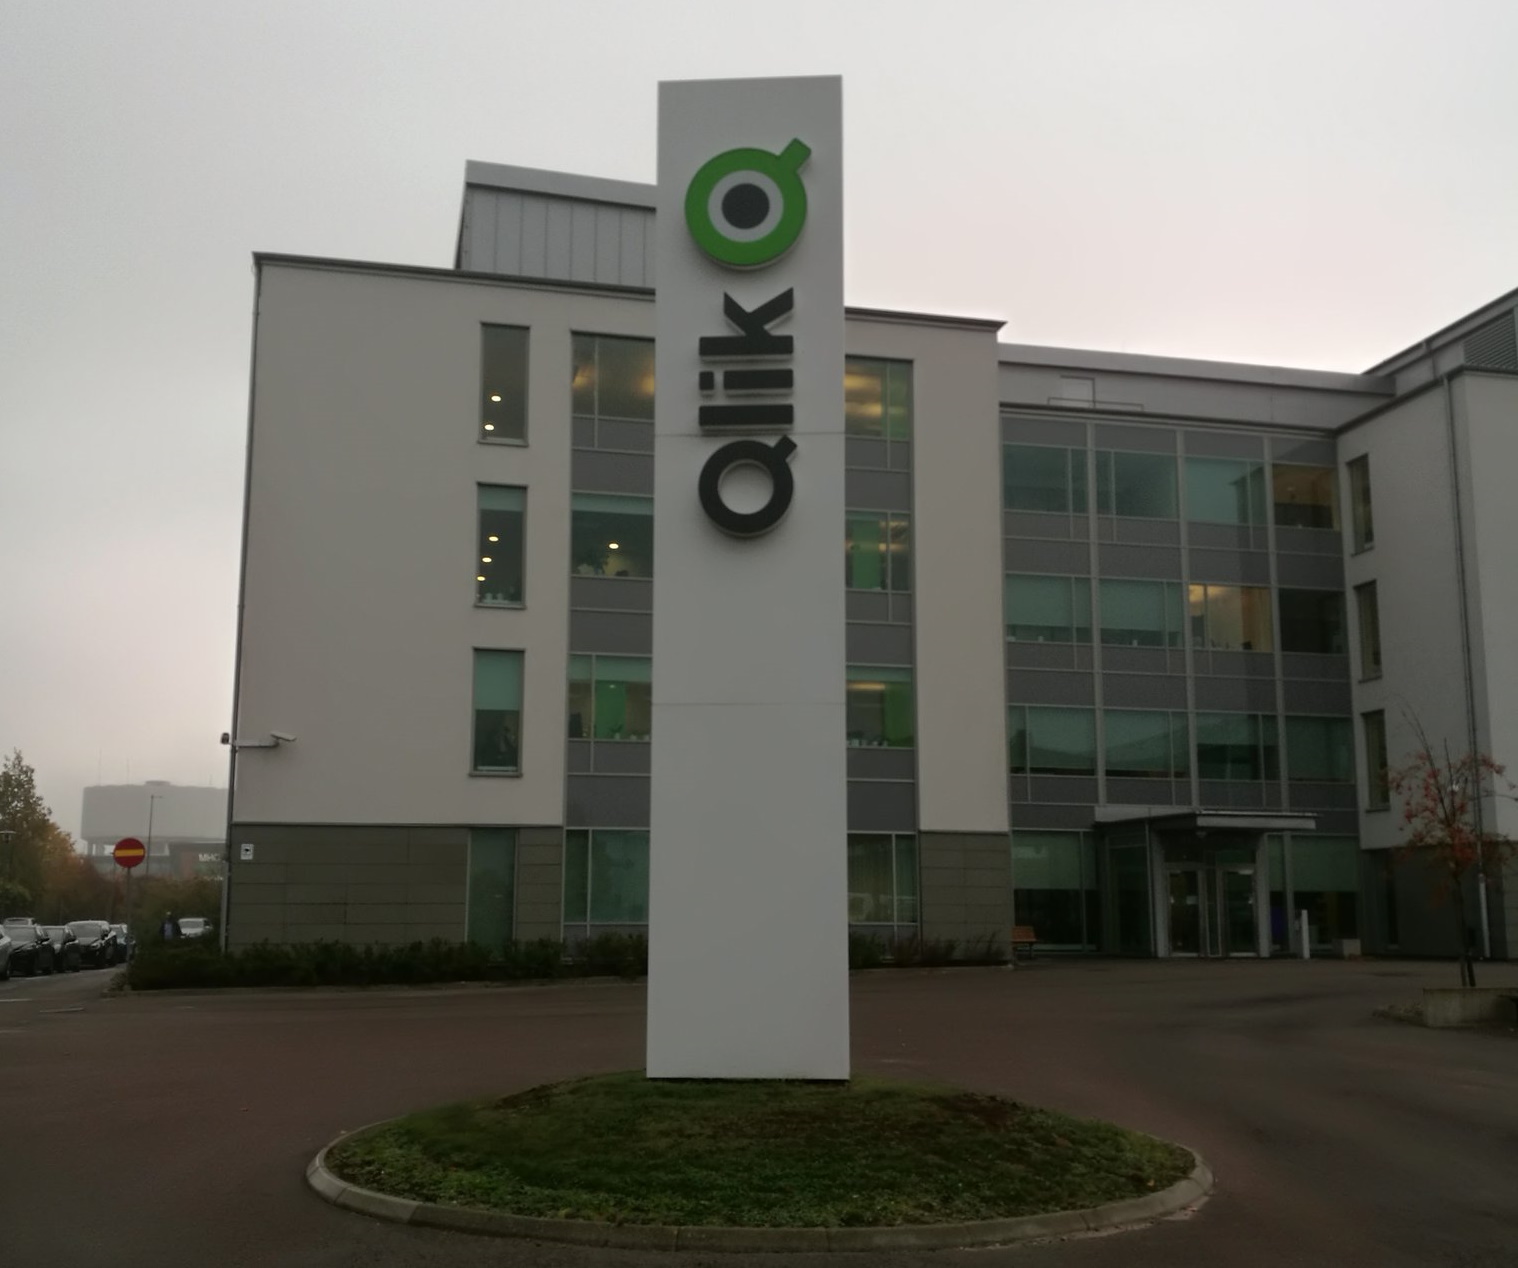 |
| Qlik HQ in Lund |
A change of role within Accenture in 2019 saw me actually move back to being a Qlik customer again as I am now part of Applied Intelligence team within Accenture's Global IT group, who own and run a very large Qlik infrastructure. We have a great team, especially my colleague Christine Afungchwi, who I was delighted to see joining the Qlik Luminary Program in 2020.
2020 saw a lot of changes for everyone, not least the move of Qlik World (formerly Qonnections) to an online format. Our Luminary meetup in the fall had to also go online, but the Program Team really knocked it out of the park with the setup and made it an event that I will never forget.
For me, 2020 also saw a big Qlik highlight where the Luminary Program team helped enable the Qlik Meetup community to go online using their WebEx connections. The very first one was the Qlik Virtual Meetup Scotland (QVMS), and I was extremely privileged that Brian, George and Andrew agreed to allow me to present at that meetup alongside Qlik's Elif Tutuk.
So now we are in 2021 and the Qlik Luminary Program is changing. They are renaming it to Qlik Luminary 50, reducing the number of members, and no longer accepting folks from the Qlik Partner ecosystem, restricting it to customer "advocates and counsellors". I think that after this length of time that it is probably right that there is a change, and it will be interesting to see what happens. But I will no longer be there.
I am in a strange position because I work for a Partner organization - Accenture regularly win the Partner of the Year accolade - but actually, because of my role in our Global IT group, I am a Qlik customer so probably could still apply. However, I think that it is time for me to retire.
While I am still passionate about Qlik, and still have some recognition as an expert across the ecosystem, it is no longer my full-time job as it was back in 2014. Although I am still an active user of Qlik tools - I have QlikView open most days and often help other teams with troubleshooting - most of my work these days is in PowerPoint and most of my team are working in Python. I never use any of the Qlik Data Integration tools - I have never needed to.
I haven't been active on Qlik Community for some time, though I remain reasonably active on social media, and have somewhat rejuvenated this Qlik Tips blog recently. But it is really just an occasional hobby as I am not working with the tools enough to generate good content for more regular updates.
Over the last year or so, as well as the QVMS, I have also presented at global industry and academic conferences, and local Qlik Meetups, where I have identified myself as a Qlik Luminary and shared my ideas and knowledge around data. I will continue to do that - except the Luminary part - as it is part of my DNA to share and educate. I suspect that most of that in future will not be Qlik related, but I will continue to apply to Qlik World to speak and share my ideas. I will continue to attend where I can. I will continue to blog here ad-hocly.
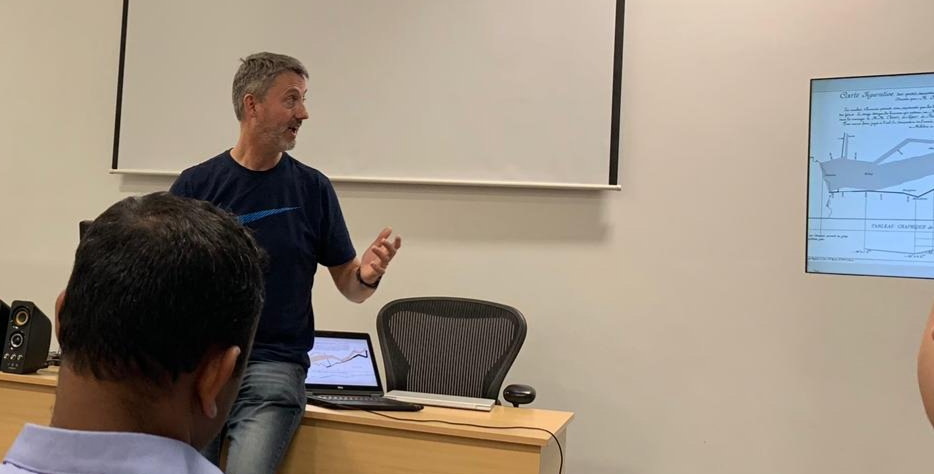 |
| Presenting at the Qlik Meetup Dublin |
I am committed to providing feedback that is constructive and actionable to Qlik, but that forum will be via our regular connects from within Accenture, where I will continue to advocate for Qlik use - not because I am a Luminary but because I believe it is a great product and we get great value out of using it.
I probably have a lot of the aspects that Qlik are looking for in their Luminary 50, but I don't think that I am going to be the Luminary that Qlik need at this stage of my career. However, I would still encourage other Qlik customers to think about applying to the new Program - I would love to see a diverse pool of people in the new club. Even if you don't think you match all the exact requirements, if you are a customer and you are passionate about Qlik, then send in an application!
I couldn't write a goodbye to the Luminary Program without mentioning three very special people: Viktoria Lindback, Carolyn Davis and Gillian Farquhar. You three have been nothing but helpful, generous and absolutely brilliant over the years and I hope that I can always call you my friends. I will always be available to you if you need help or advice.
In the words of the late, great, Douglas Adams, so long, and thanks for all the fish!

As well as holding a Master's Degree in Data Analytics, Stephen Redmond is a practicing Data Professional of over 20 years experience. He is author of Mastering QlikView, QlikView for Developer's Cookbook and QlikView Server and Publisher.
Follow @stephencredmond